
Energy uncertainty becomes unit cost.
For energy-intensive operations, the price distribution, not the forecast, determines exposure. Hydrology, commodity shocks and contract structure combine into a cost range that production and treasury must decide against.
Use cases
Where energy and operations hit unit cost, and how the stack holds.
One fold per pain: what breaks, how Grand Thera's decision-grade AI stack resolves it, and an interactive figure to explore.
01 / 03
The pain
Energy price volatility lands directly in unit cost.
Hydrology, commodities and contract structure combine into a cost range, but plans are made on a single forecast.
How Grand Thera solves it
Price distributions, not point forecasts: AIT Agents simulate the fan of outcomes and the share that reaches unit cost.
Contract coverage decided against the full distribution.
Interactive figure · demonstration data
02 / 03
The pain
Raw-material variability destabilizes the line.
Input quality drifts, machine setup lags and OEE pays the price.
How Grand Thera solves it
TheraOS unifies quality, telemetry and production data; AITs recommend setup and anticipate maintenance before degradation.
Variability turned into a controllable operating variable.
Interactive figure · demonstration data
AIT Agents
The agents that address these problems.
Choose an agent to see what it watches and what it brings to a decision. If yours is not here, we build it.
03 / 03
The pain
Unplanned downtime is discovered, not predicted.
Failure analysis depends on manual review across disconnected systems.
How Grand Thera solves it
Failure probability per asset and horizon, with service orders triggered on threshold breach.
Maintenance scheduled by risk, not by calendar.
Interactive figure · demonstration data
Scenario
Contract coverage decides how much uncertainty reaches the P&L.
Lineage
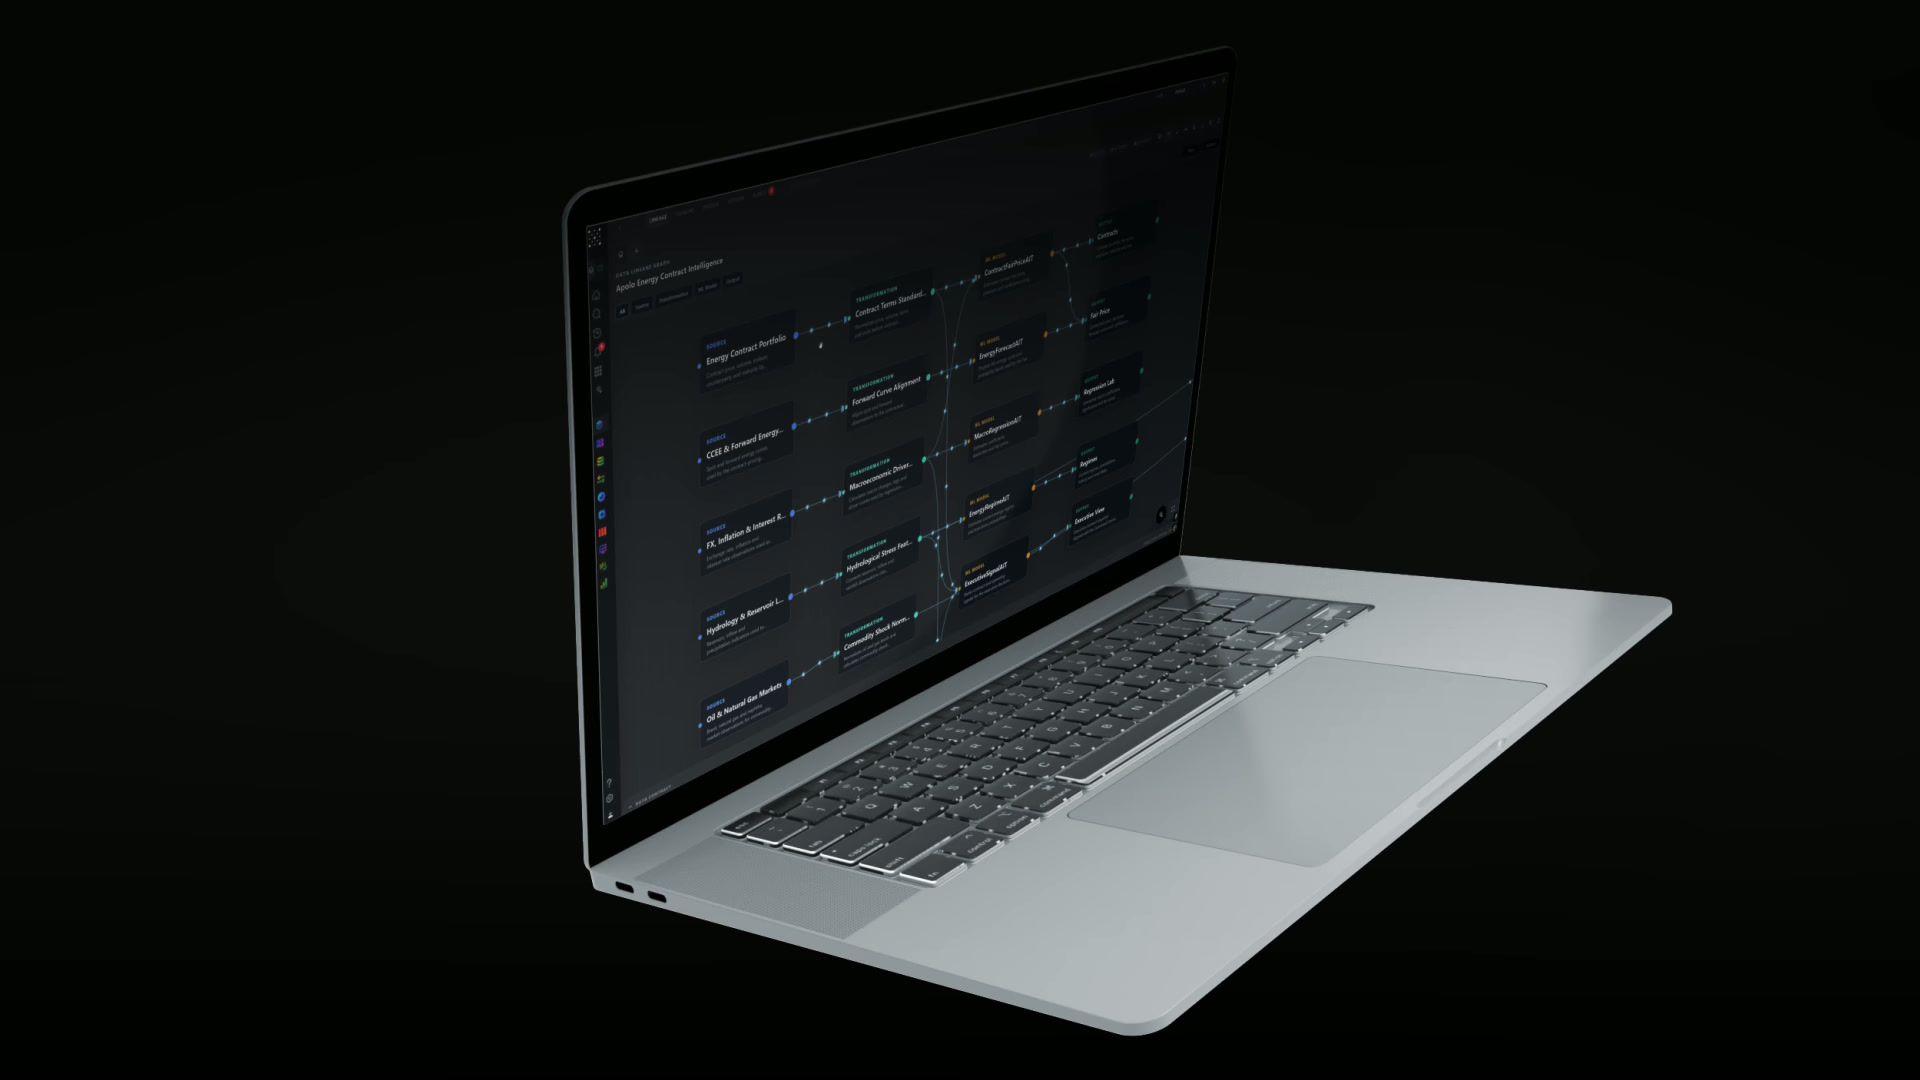
From hydrology to production impact.
Energy contracts, forward curves, FX, hydrology and reservoir levels, commodity markets, plant consumption and production data feed models for fair contract price, energy regimes, exposure and production impact.

Decisions supported
Where operations meet treasury.
Energy pricing exposure
Price distributions and regimes, with the share of exposure that is contracted versus spot.
Industrial dependencies
How a constraint in one plant or input propagates through production.
Operational uncertainty
Output, downtime and demand uncertainty stated, not assumed away.
Cost propagation
Energy and input shocks traced into unit cost and margin.
Scenario-based decisions
Contracting, hedging and production choices compared under base and stress scenarios.