
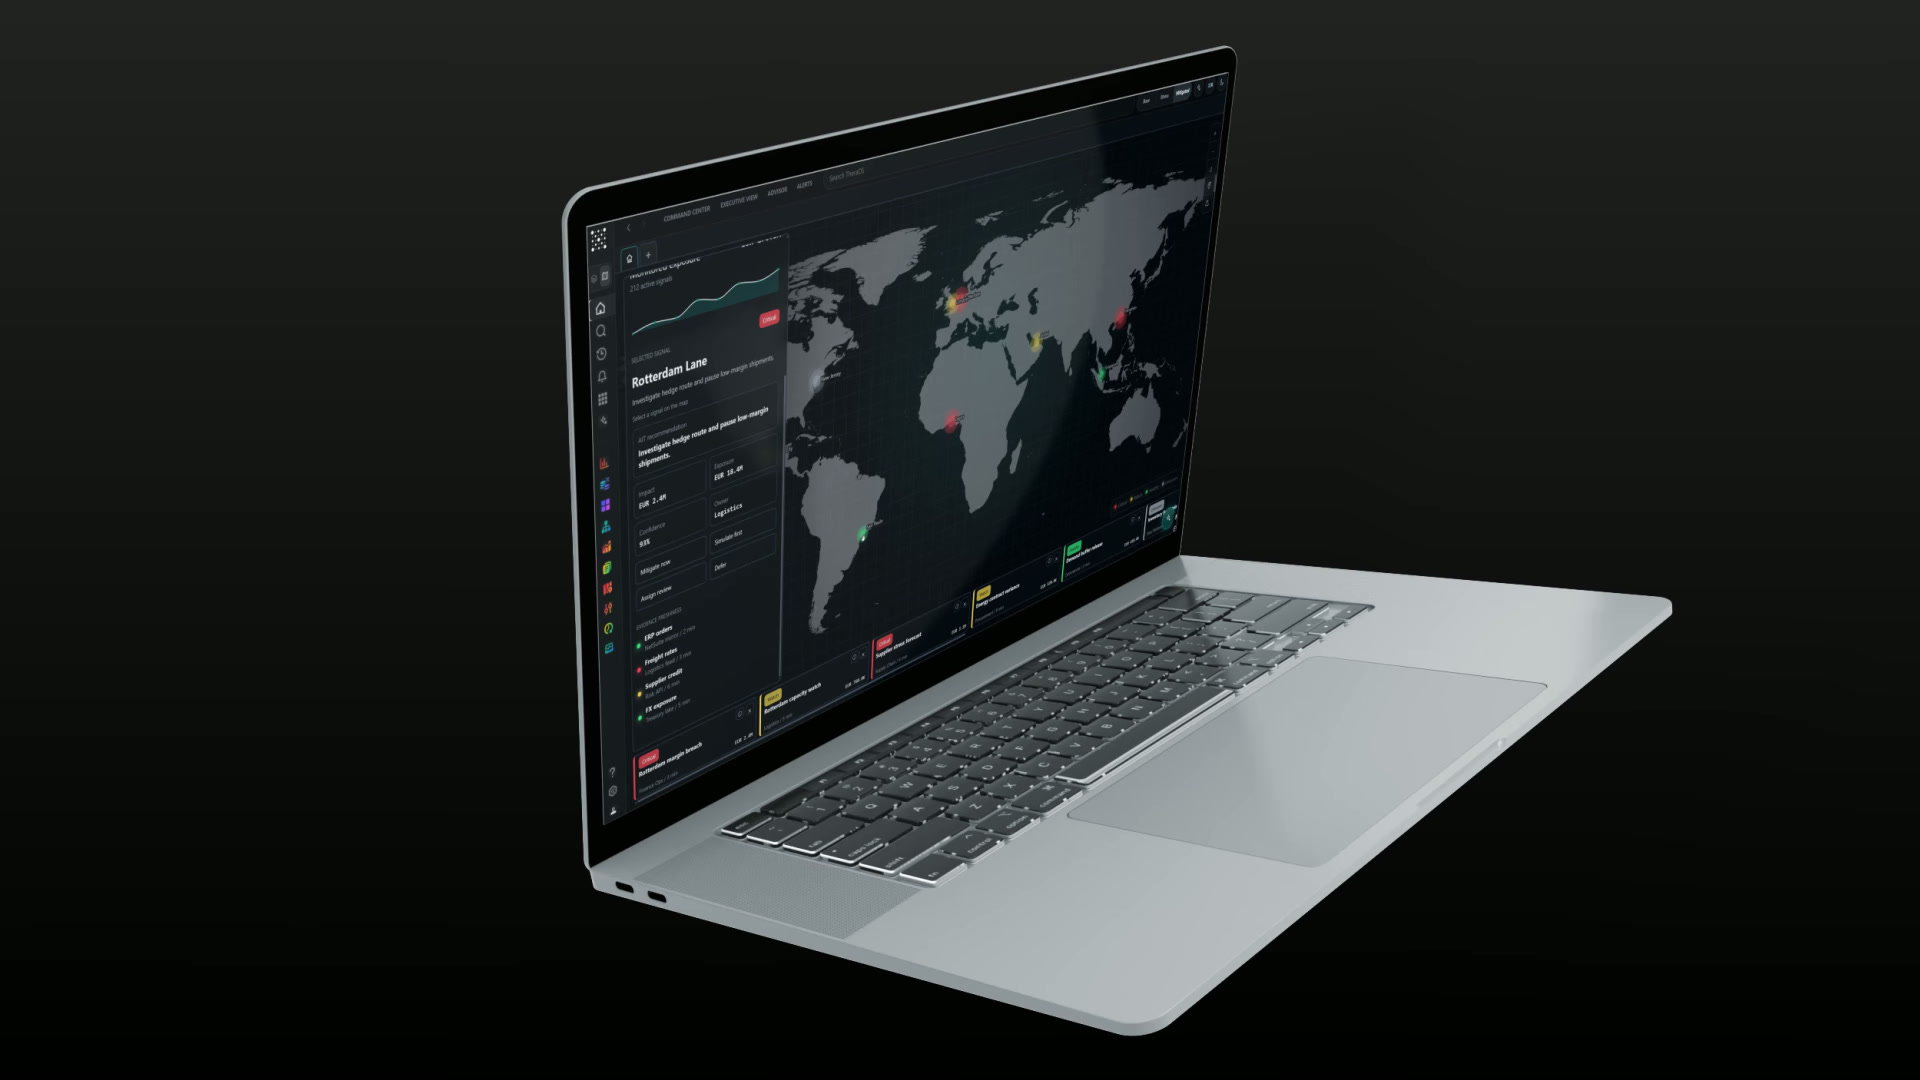
A delay upstream is a margin problem downstream.
Supplier networks absorb small shocks until their buffers are exhausted. After that, delay compounds into expediting, carrying cost and lost margin. The decision is whether to act while disruption is still a probability.
Use cases
Where disruption turns into margin loss, and how the stack holds.
One fold per pain: what breaks, how Grand Thera's decision-grade AI stack resolves it, and an interactive figure to explore.
01 / 03
The pain
A supplier fails and you learn it from the shortage.
Tier-2 and tier-3 dependencies are invisible until a component is missing on the line.
How Grand Thera solves it
TheraOS maps supplier dependencies across ERP, logistics and credit data; AIT Agents forecast supplier stress before it propagates.
Supplier risk qualified while alternatives still exist.
Interactive figure · demonstration data
02 / 03
The pain
Delay compounds into margin loss nobody priced.
Expediting, carrying cost and penalties accumulate across business units with no single owner.
How Grand Thera solves it
Disruption is propagated through the network and mapped to the P&L line it hits, with an accountable owner.
The cost of delay known before the decision to wait.
Interactive figure · demonstration data
AIT Agents
The agents that address these problems.
Choose an agent to see what it watches and what it brings to a decision. If yours is not here, we build it.
03 / 03
The pain
Logistics lanes breach margin silently.
Freight, FX and mix effects combine lane by lane, while dashboards report averages.
How Grand Thera solves it
Lane-level signals with impact, exposure, confidence and recommended response; mitigate, simulate, assign or defer.
Every lane held against its margin threshold.
Interactive figure · demonstration data
Propagation
Buffers hide risk until they don't.
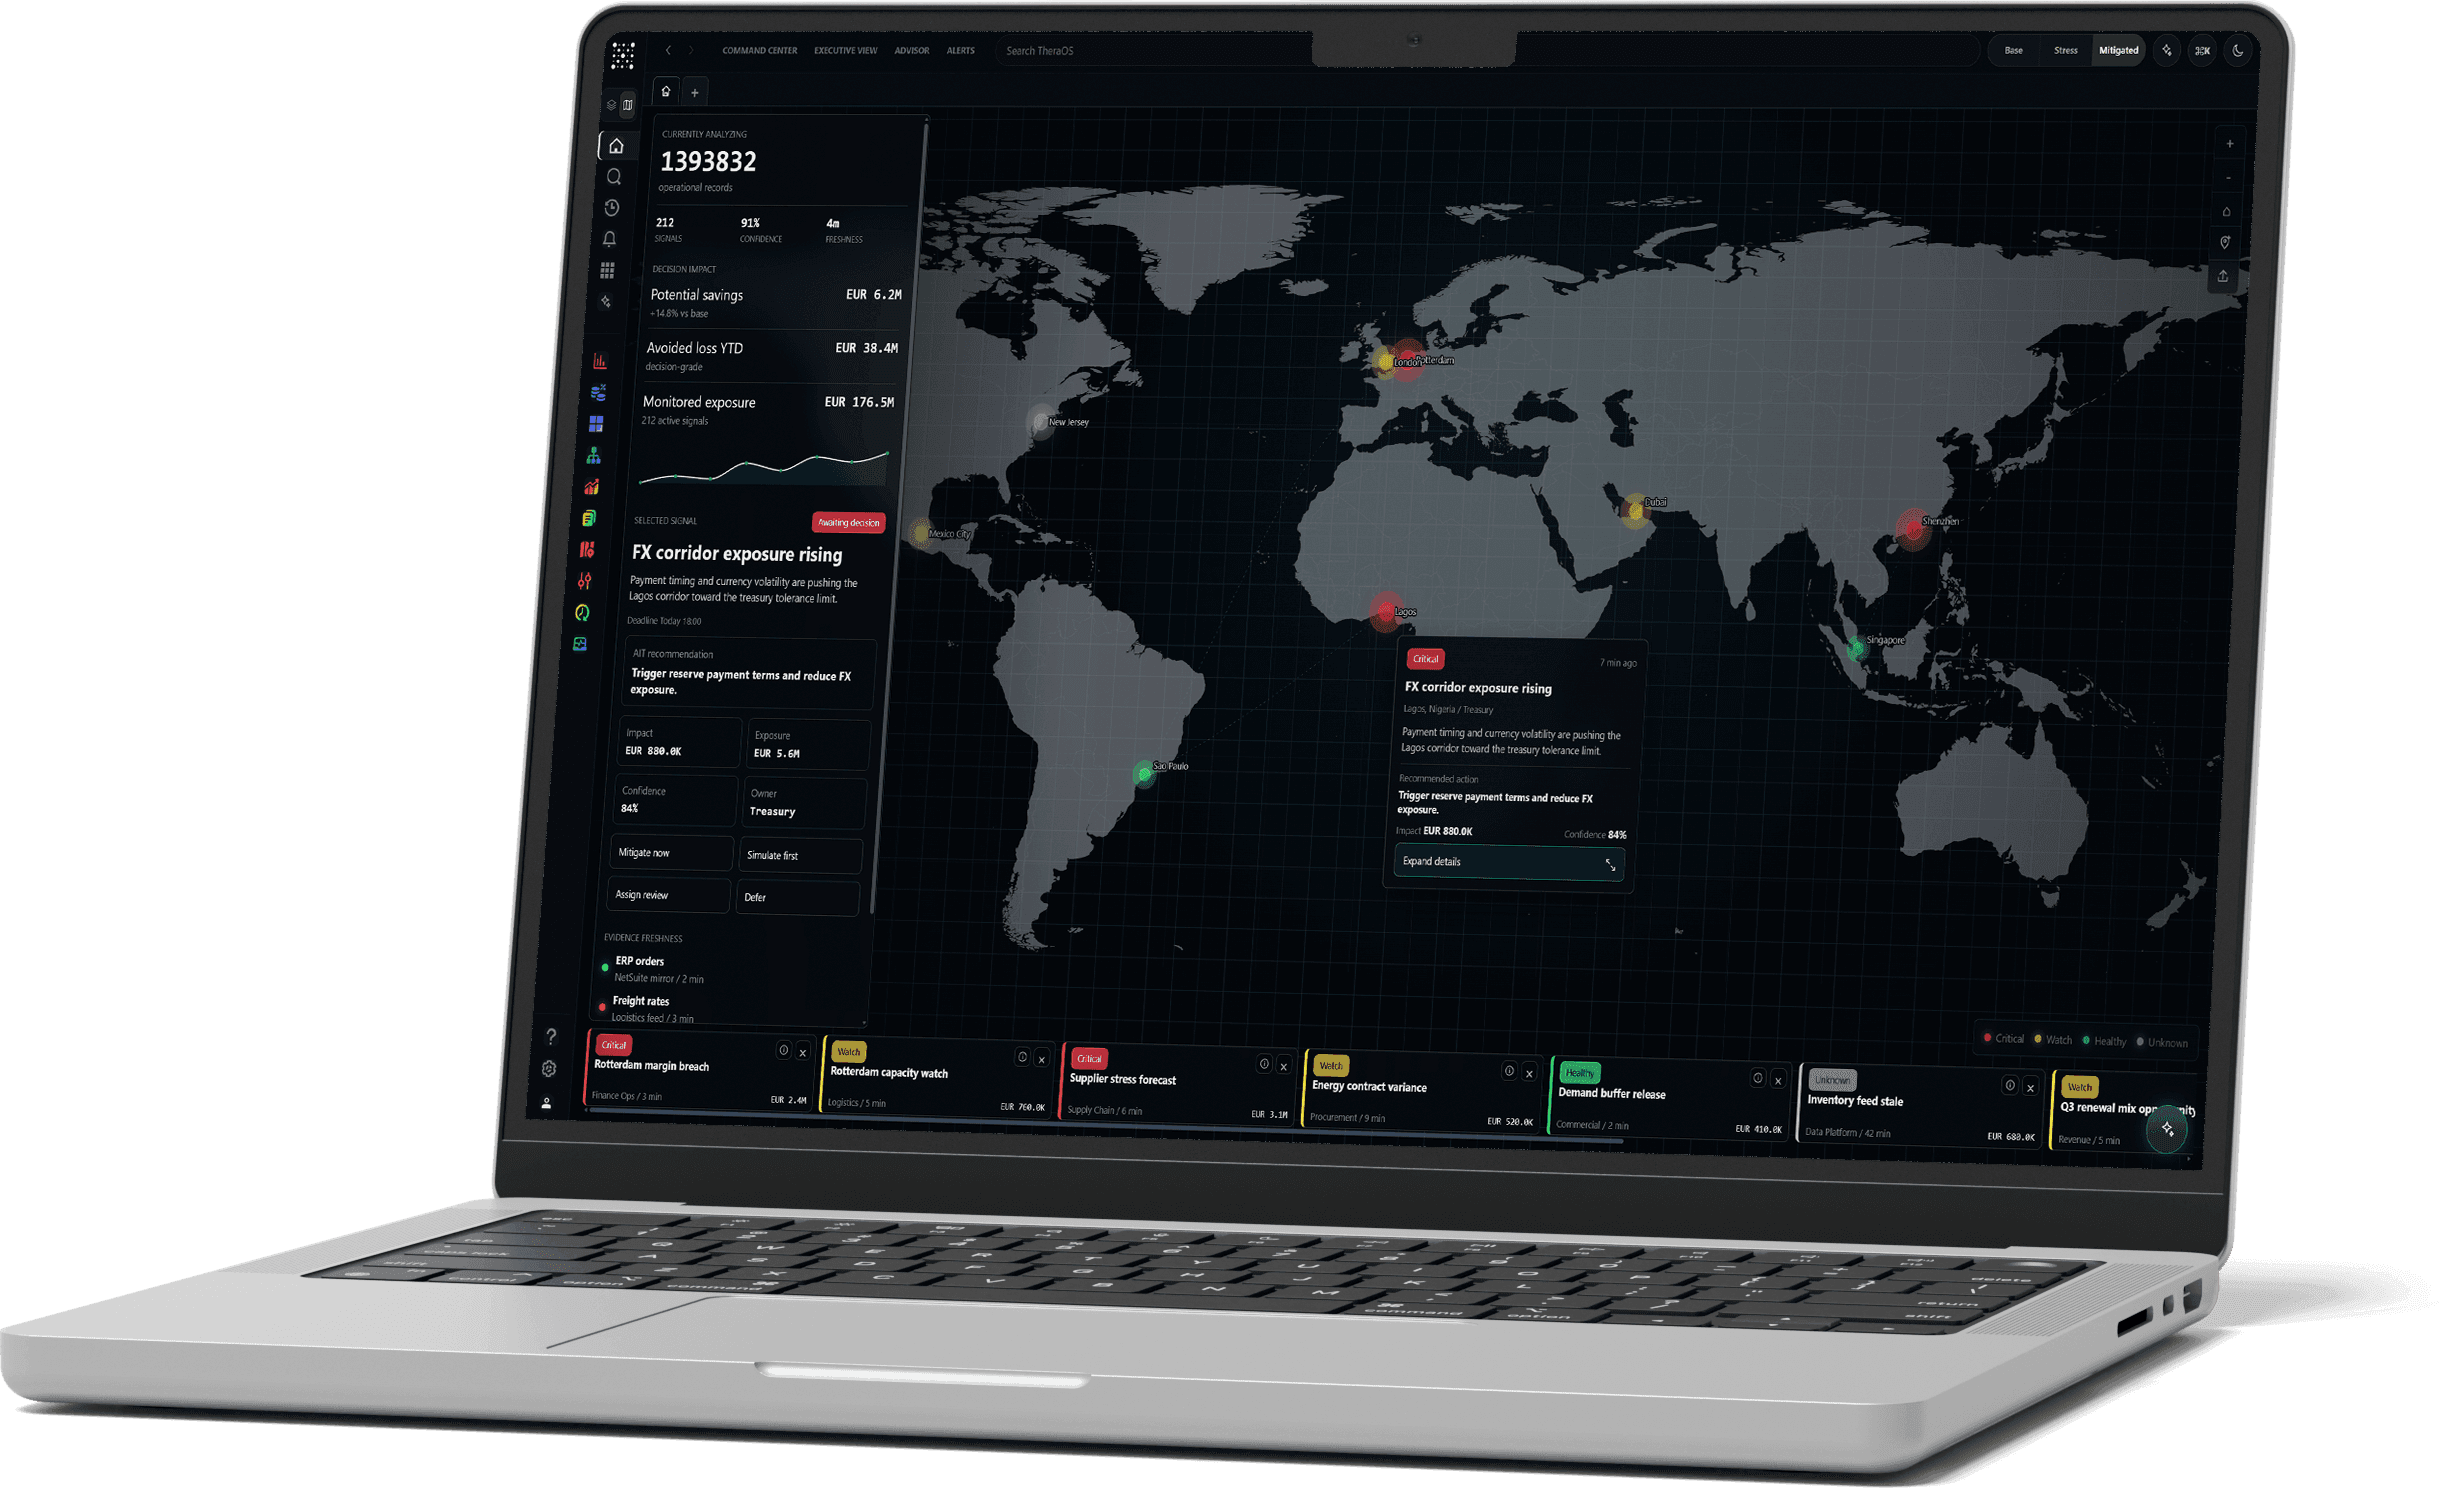
In the Command Center
Operational signals with financial weight.
Supplier stress forecasts, port capacity watches and freight-rate freshness appear alongside their estimated impact and the owner responsible for the response.
Decisions supported
Before the disruption becomes a cost.
Supplier dependencies
Which suppliers, at which tier, carry concentrated risk.
Bottlenecks
Where buffers are thin and delay will propagate.
Disruption propagation
How a delay travels through the network into customer commitments.
Cost volatility
Freight, input and energy cost distributions, not point estimates.
Cost of delay
Expediting, inventory carrying and lost margin estimated before the decision.